FBinsightsR - get Facebook Marketing Insights into R, easily

How (and why) we built a package for R Studio to pull data from Facebook’s marketing API
In a previous post we touched upon some of the work we’ve been doing using R to create and manage paid ad campaigns.
The first point to note is that we are seeing some amazing results from the campaigns we are running. For one client and using our hyper-local platform, Serendipity, we’ve seen in-store sales volume in our target area outperform non-target areas on average by 25%.
While Facebook is an extraordinarily effective medium through which to advertise, we attribute a lot of the success to the depth of analysis we can perform by using tools we’ve written in R.
The purpose of our hyper-local advertising program is to drive foot traffic based purchases or patronage. The sales data we receive from clients or distributors varies in format and frequency. Despite the irregularity in data we receive, we have to detect sales in a consistent, structured way to inform ongoing media and creative optimization.
Excel made me do it
Attempting this kind of analysis with Excel becomes impractical with hundreds of thousands of lines of data for a week’s campaign performance. Moreover Excel is a honey-pot for errors.
This is why we use R. We’ve been able to automate analysis and repetitive tasks, and isolate performance segments that the standard reporting in Facebook can’t do.
So, we thought we’d build — and share — an R package comprising functions we wrote to get insights data out of Facebook (imaginatively) called FBinsightsR.
There are some other packages that do similar things, but we’d thought we’d keep this really, really, simple. Just enter the date range, reporting level (ad, adset, campaign etc), and access token, and a nice, tidy data frame will be returned without the need to mess around with JSON parsing.
What FBinsightsR actually does
FBinsightsR currently has two functions that perform the following operations:
fbins_summ: Detailed ad performance data like click through rate, cost per click, canvas engagement, etc by DAY.
fbins_ag: The same as above but by AGE and GENDER, as well as day.
The data frame you can extract from Facebook’s marketing API will look something like this:
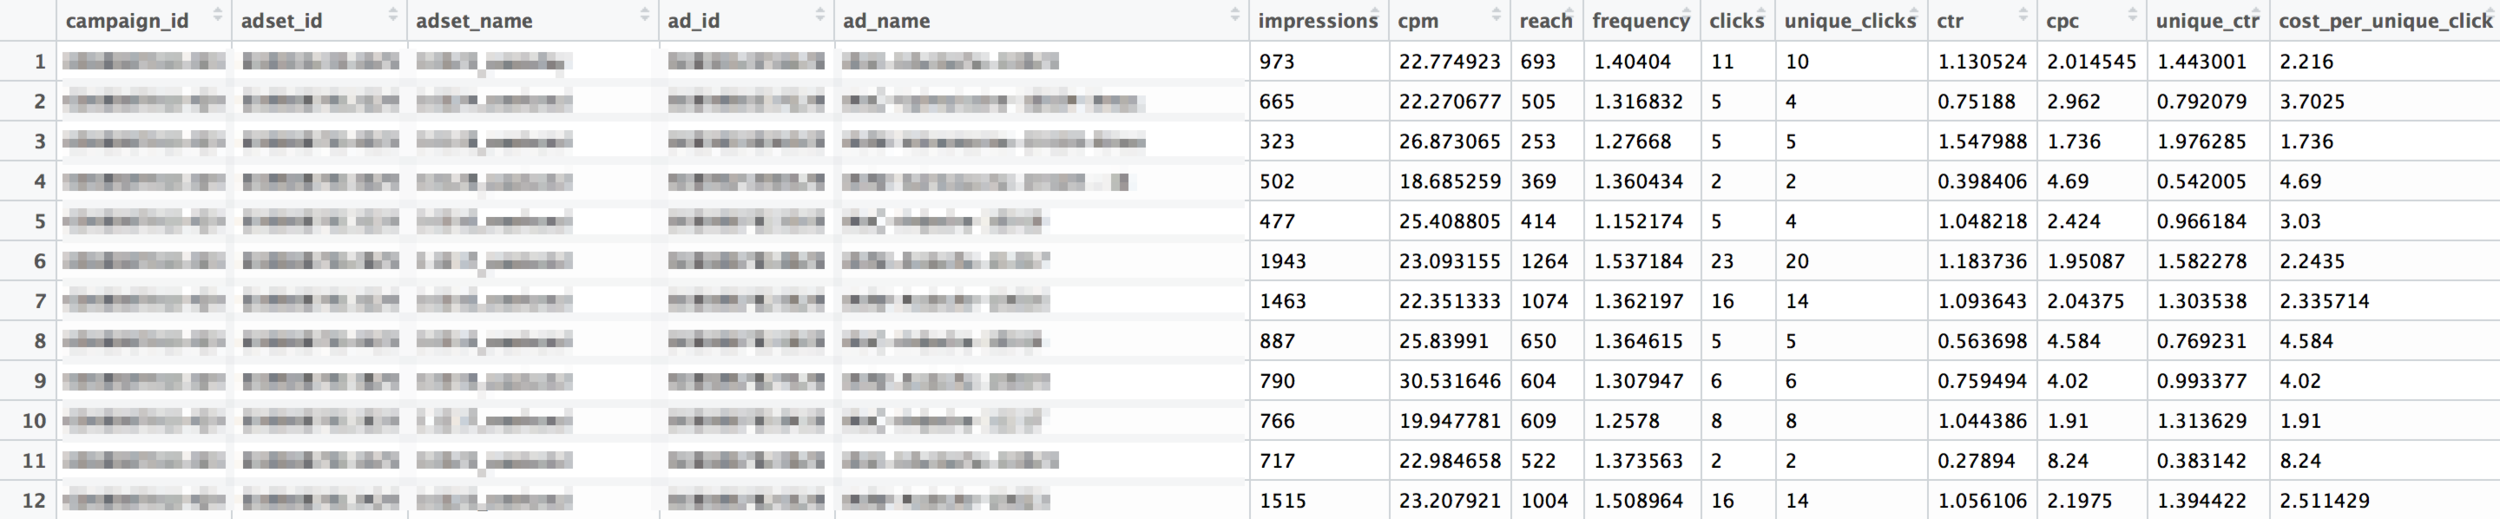
Sample FBinsightsR data frame
How to get the package
The package we created is available at https://github.com/Deducive/FBinsightsR
To use it, you’ll need the RStudio devtools installed first:
install.packages(“devtools”)
Then, run the following code:
	library(devtools)
	install_github(‘Deducive/FBinsightsR’)
	library(FBinsightsR)
To see the guides for the 2 functions in the package, you might want to run the following:
	?fbins_summ
	?fbins_ag
Feedback please!
We’d love to hear what you think of the package and get your feedback on how to improve. You can submit issues via Git or contact us directly at hello@deducive.com. Happy analyzing!